Difference between revisions of "Report Functional Area"
(→Description) |
|||
| (47 intermediate revisions by 3 users not shown) | |||
| Line 1: | Line 1: | ||
== Description == | == Description == | ||
| − | The '''Reports''' icon located on the FacilityFit main page and on the shortcut menu are links to the '''Reports''' landing page. | + | The '''Reports''' icon located on the FacilityFit main page and on the shortcut menu are links to the '''Reports''' landing page. View the full [[List of Functional Area Reports#List of Functional Area Reports|List of Functional Area Reports]]. |
| − | [[Image:menuReports.png]] | + | [[Image:menuReports.png|80px]] |
== Reports Tab == | == Reports Tab == | ||
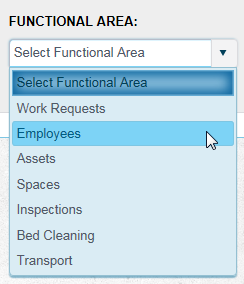
| − | + | Use the '''Report''' landing page to run, view, save, schedule and print a variety of reports. There are two tabs on the Reports page. The '''Reports''' tab queries specific filters by Functional Area. The [[Report Functional Area#Dashboard Tab|Dashboard Tab]] displays inspection statistics. <br />From the '''Reports''' tab select choices from the '''Functional Area''' and '''Reports''' drop-down lists to run the report. Refer to: [[Report Functional Area#Saving, Running Reports|Running Reports]].<br /> | |
| − | [[Image: | + | [[Image:ReportsTab.png|900px]] |
| + | === Running Reports === | ||
| + | {| class="wikitable" border="1" | ||
| + | |-style="vertical-align:top;" | ||
| + | |<big>'''<font size="5">1</font>'''</big> | ||
| + | |From the [[Report Functional Area#Reports Tab|Reports Tab]]:<br /> | ||
| + | * Select a '''Functional Area''' from the drop-down list (required). The '''Reports''' drop-down list in the next step populates based on the '''Functional Area''' selected here.<br /> | ||
| + | [[Image:FunctArea.png]] | ||
| + | |-style="vertical-align:top;" | ||
| + | |<big>'''<font size="5">2</font>'''</big> | ||
| + | | | ||
| + | * Make a selection from the '''Reports''' drop-down list. <br /> | ||
| + | * Use the scroll bar, if available, to see the entire list. <br /> | ||
| + | After you make your selection, multiple filter fields display underneath.<br /> | ||
| + | [[Image:Reports.png|800px]] | ||
| + | |-style="vertical-align:top;" | ||
| + | |<big>'''<font size="5">3</font>'''</big> | ||
| + | | | ||
| + | * Select from the available drop-down lists. <br /> | ||
| + | * Enter text into the fields. <br /> | ||
| + | For more info refer to (link here to a list that defines the fields).<br /> | ||
| + | <small>'''Optional:''' Click the '''Save Filter''' button to save your choices and use them again on your next visit. Refer to: [[Report Functional Area#Saving, Retrieving and Deleting Custom Filters|Saving, Retrieving and Deleting Custom Filters]].</small><br /> | ||
| + | |||
| + | [[Image:CampusFilter2.png|800px]] | ||
| + | |-style="vertical-align:top;" | ||
| + | |<big>'''<font size="5">4</font>'''</big> | ||
| + | | | ||
| + | * Click the '''Run''' button. <br /> | ||
| + | * Print or export the report. <br /> | ||
| + | Refer to: [[Report Functional Area#Printing and Exporting a Report|Printing and Exporting a Report]].<br /> | ||
| − | [[Image: | + | [[Image:Run.png]] |
| − | + | |-style="vertical-align:top;" | |
| − | + | ||
| − | + | ||
| − | |- | + | |
| − | + | ||
| − | + | ||
| − | + | ||
| − | + | ||
| − | + | ||
| − | + | ||
| − | + | ||
| − | + | ||
| − | + | ||
| − | + | ||
| − | + | ||
| − | + | ||
| − | + | ||
| − | + | ||
| − | + | ||
| − | + | ||
| − | + | ||
| − | + | ||
| − | + | ||
| − | + | ||
| − | + | ||
|} | |} | ||
=== Saving, Retrieving and Deleting Custom Filters === | === Saving, Retrieving and Deleting Custom Filters === | ||
| − | {| class="wikitable" border="1" | + | {| class="wikitable" border="1" |
| − | | | + | |-style="vertical-align:top;" |
| − | + | |<big>'''<font size="5">1</font>'''</big> | |
| − | + | |To save a filter: | |
| − | |- | + | * Select options from the '''Functional Area''' and the '''Reports''' drop-down lists to create a '''Save Filter'''. |
| − | + | [[Image:SelectReport2.png|800px]] | |
| − | + | |-style="vertical-align:top;" | |
| − | + | |<big>'''<font size="5">2</font>'''</big> | |
| − | + | | | |
| − | + | * Select filter choices from the available drop-down lists.<br /> | |
| − | |style=" | + | * Type in the text fields. |
| − | + | [[Image:CampusFilter2.png|800px]] | |
| − | |- | + | |
| − | |4 | + | |-style="vertical-align:top;" |
| − | |Type a '''Filter Name''' in the text field | + | |<big>'''<font size="5">3</font>'''</big> |
| − | + | | | |
| − | + | * Click on the '''Save Filter''' button in the menu bar located above the filter fields. | |
| − | + | [[Image:SaveFilter.png]] | |
| − | |style=" | + | |
| + | |-style="vertical-align:top;" | ||
| + | |<big>'''<font size="5">4</font>'''</big> | ||
| + | | | ||
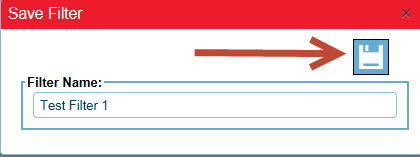
| + | * Type a '''Filter Name''' in the text field. | ||
| + | * Click the '''Save''' icon. | ||
| + | A message displays to confirm the '''Filter Name''' was saved.<br /> | ||
| + | |||
| + | [[Image:FilterName.png]] | ||
| + | |||
| + | |-style="vertical-align:top;" | ||
| + | |<big>'''<font size="5">5</font>'''</big> | ||
| + | | | ||
| + | To retrieve the saved filter on your next visit: | ||
* Select the same '''Functional Area''' and '''Report''' choices used to created the '''Filter'''. | * Select the same '''Functional Area''' and '''Report''' choices used to created the '''Filter'''. | ||
| − | * Select your saved filter from the '''Filter''' drop-down list. The filter fields automatically populate. | + | * Select your saved filter from the '''Filter''' drop-down list. |
| − | + | The filter fields automatically populate.<br /> | |
| − | + | ||
| − | + | [[Image:Filter.png]] | |
| − | |style=" | + | |
| − | + | |-style="vertical-align:top;" | |
| − | |- | + | |<big>'''<font size="5">6</font>'''</big> |
| − | + | |Click the '''Run''' button. | |
| − | + | [[Image:Run.png]] | |
| + | |-style="vertical-align:top;" | ||
| + | |<big>'''<font size="5">7</font>'''</big> | ||
| + | |To delete the '''Save Filter''': | ||
* Select the same '''Functional Area''' and '''Report''' choices used to create the '''Save Filter'''. | * Select the same '''Functional Area''' and '''Report''' choices used to create the '''Save Filter'''. | ||
* Select the '''Filter''' from the drop-down list. | * Select the '''Filter''' from the drop-down list. | ||
* Click the '''Delete Filter''' button. | * Click the '''Delete Filter''' button. | ||
| − | + | [[Image:DeleteFilter.png]] | |
| − | |- | + | |-style="vertical-align:top;" |
|} | |} | ||
| Line 83: | Line 104: | ||
TBA | TBA | ||
=== Printing and Exporting a Report === | === Printing and Exporting a Report === | ||
| − | {| class="wikitable" border="1" | + | {| class="wikitable" border="1" |
| − | + | ||
| − | + | ||
| − | + | ||
| − | |[[Image: | + | |-style="vertical-align:top;" |
| − | + | |<big>'''<font size="5">1</font>'''</big> | |
| − | + | |After the report generates, refer to: [[Report Functional Area#Running Reports|Running Reports]], a menu bar becomes available at the top of the report. | |
| − | |style=" | + | Click the '''Print''' icon to send the report to the printer.<br />[[Image:PrintReport.png]] |
| − | + | ||
| − | + | |-style="vertical-align:top;" | |
| − | + | |<big>'''<font size="5">2</font>'''</big> | |
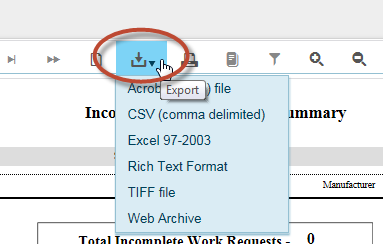
| − | |style=" | + | |Use the '''Export''' icon drop-down arrow to select an option for saving the report in a specific format.<br /> |
| − | |[[Image: | + | [[Image:ExportReport.png]] |
| + | |||
| + | |-style="vertical-align:top;" | ||
| + | |<big>'''<font size="5">3</font>'''</big> | ||
| + | |Use the menu bar functions to view, print, export or save the report. | ||
| + | Hover the mouse pointer over each icon for its action description. Refer to: [[Report Functional Area#Report Navigation Menu Bar|Report Navigation Menu Bar]].<br />[[Image:ReportIcons.png]] | ||
| + | |||
| + | |-style="vertical-align:top;" | ||
|} | |} | ||
| Line 124: | Line 149: | ||
[[Image:Dashboard.png|900px]] | [[Image:Dashboard.png|900px]] | ||
=== Viewing Statistics on the Dashboard === | === Viewing Statistics on the Dashboard === | ||
| − | {| class="wikitable" border="1 | + | {| class="wikitable" border="1" |
| − | |- | + | |-style="vertical-align:top;" |
| − | + | |<big>'''<font size="5">1</font>'''</big> | |
| − | + | |Select choices from the drop-down lists. | |
| − | + | [[Image:DashbdSelect.png|800px]] | |
| − | |- | + | |-style="vertical-align:top;" |
| − | + | |<big>'''<font size="5">2</font>'''</big> | |
| − | + | |Click the '''Apply''' button to see results. | |
| − | + | [[Image:DashbdApply.png|800px]] | |
| − | |- | + | |-style="vertical-align:top;" |
| − | + | |<big>'''<font size="5">3</font>'''</big> | |
| − | + | |Click the '''Reset''' button to return to the default view. | |
| − | + | [[Image:DashbdReset.png|800px]] | |
|} | |} | ||
| + | |||
=== Analyzing Dashboard Results === | === Analyzing Dashboard Results === | ||
| + | After filtering the dashboard, all of the graphs and charts will be updated to reflect new data. The data is broken down as shown in the following table. If you would like to see more, less, or different data, simply choose an appropriate set of filters as described in [[Report Functional Area#Saving, Retrieving and Deleting Custom Filters|Saving, Retrieving and Deleting Custom Filters]] | ||
{| class="wikitable" border="1" | {| class="wikitable" border="1" | ||
| − | |- | + | |
| − | |[[Image:InspectPass.png]] | + | |-style="vertical-align:top;" |
| − | | | + | | style="text-align:center"|[[Image:InspectPass.png|InspectPass.png]] |
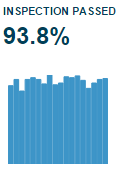
| − | |- | + | |Shows the percentage of Inspections that have achieved the Target Threshold or higher. Each vertical bar represents one week of Inspections. You may hover your mouse over an area of this graph to get more specific data. |
| − | |[[Image:InspectReport.png]] | + | |
| − | |Inspections | + | |
| − | |- | + | |-style="vertical-align:top;" |
| − | |[[Image:AvgScore.png]] | + | |style="text-align:center"|[[Image:InspectReport.png]] |
| − | | | + | |Indicates the number of Inspections that are being reported on the dashboard at this time. |
| − | |- | + | |
| − | |[[Image:CampusReprt.png]] | + | |-style="vertical-align:top;" |
| − | |Campuses | + | |style="text-align:center"|[[Image:AvgScore.png]] |
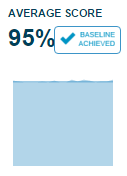
| − | |- | + | |The blue area shows the average score for Inspections each week. The higher the blue area, the higher the overall score. You may hover your mouse over an area of this graph to get more specific data. |
| − | |[[Image:AvgScrSpace.png]] | + | |
| − | |Average Score by Space Type | + | |-style="vertical-align:top;" |
| − | |- | + | |style="text-align:center"|[[Image:CampusReprt.png]] |
| − | |[[Image:Top5.png]] | + | |The number of Campuses that are included in the dashboard results. |
| + | |||
| + | |-style="vertical-align:top;" | ||
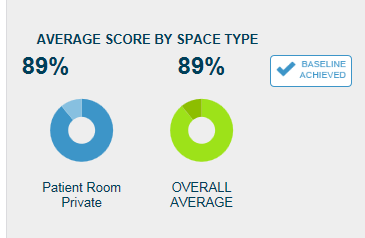
| + | |style="text-align:center"|[[Image:AvgScrSpace.png]] | ||
| + | |Average Score by Space Type. | ||
| + | |||
| + | |-style="vertical-align:top;" | ||
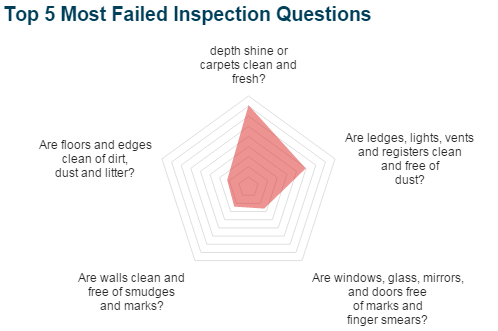
| + | |style="text-align:center"|[[Image:Top5.png]] | ||
|Top 5 Most Failed Inspection Questions. | |Top 5 Most Failed Inspection Questions. | ||
| − | |- | + | |
| − | |[[Image:Questions.png]] | + | |-style="vertical-align:top;" |
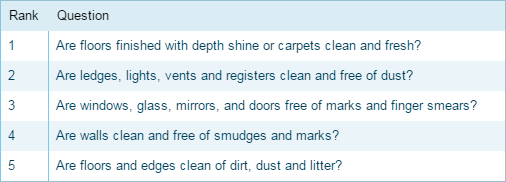
| − | |Rank/Question | + | |style="text-align:center"|[[Image:Questions.png]] |
| + | |Rank/Question. | ||
|} | |} | ||
Latest revision as of 13:07, 15 April 2016
Contents
Description
The Reports icon located on the FacilityFit main page and on the shortcut menu are links to the Reports landing page. View the full List of Functional Area Reports.
Reports Tab
Use the Report landing page to run, view, save, schedule and print a variety of reports. There are two tabs on the Reports page. The Reports tab queries specific filters by Functional Area. The Dashboard Tab displays inspection statistics.
From the Reports tab select choices from the Functional Area and Reports drop-down lists to run the report. Refer to: Running Reports.
Running Reports
| 1 | From the Reports Tab:
|
| 2 |
After you make your selection, multiple filter fields display underneath. |
| 3 |
For more info refer to (link here to a list that defines the fields). |
| 4 |
Refer to: Printing and Exporting a Report. |
Saving, Retrieving and Deleting Custom Filters
| 1 | To save a filter:
|
| 2 |
|
| 3 |
|
| 4 |
A message displays to confirm the Filter Name was saved. |
| 5 |
To retrieve the saved filter on your next visit:
The filter fields automatically populate. |
| 6 | Click the Run button. |
| 7 | To delete the Save Filter:
|
Scheduling a Report
TBA
Printing and Exporting a Report
| 1 | After the report generates, refer to: Running Reports, a menu bar becomes available at the top of the report. |
| 2 | Use the Export icon drop-down arrow to select an option for saving the report in a specific format. |
| 3 | Use the menu bar functions to view, print, export or save the report.
Hover the mouse pointer over each icon for its action description. Refer to: Report Navigation Menu Bar. |
- Navigate Backward - Go to the previous page in the report.
- Navigate Forward - Go the next page in the report.
- Refresh - Reload the report to include latest information since the last time it was generated.
- First Page - Go to the first page in the report.
- Previous Page - Go to the page that comes before the page that is currently displayed.
- Page Counter - Displays the page you are on and the total number of pages in the report. You can enter a page number in the field and hit enter to go to that page.
- Next Page - Go to the next page.
- Last Page - Go to the last page in the report.
- Toggle Print Preview - View the report how it would look if it was printed.
- Export - Drop-down list showing available options for exporting the report.
- Print - Send the report to the printer of your choice.
- Toggle Document Map - Not functional.
- Toggle Parameters Area - Not functional.
- Zoom In - Magnify the view of the report page that is displayed.
- Zoom Out - Shrink the view of the report page that is displayed.
- Toggle Full Page/Page Width - On/Off switch to fit the full page of the report to display on your screen.
Dashboard Tab
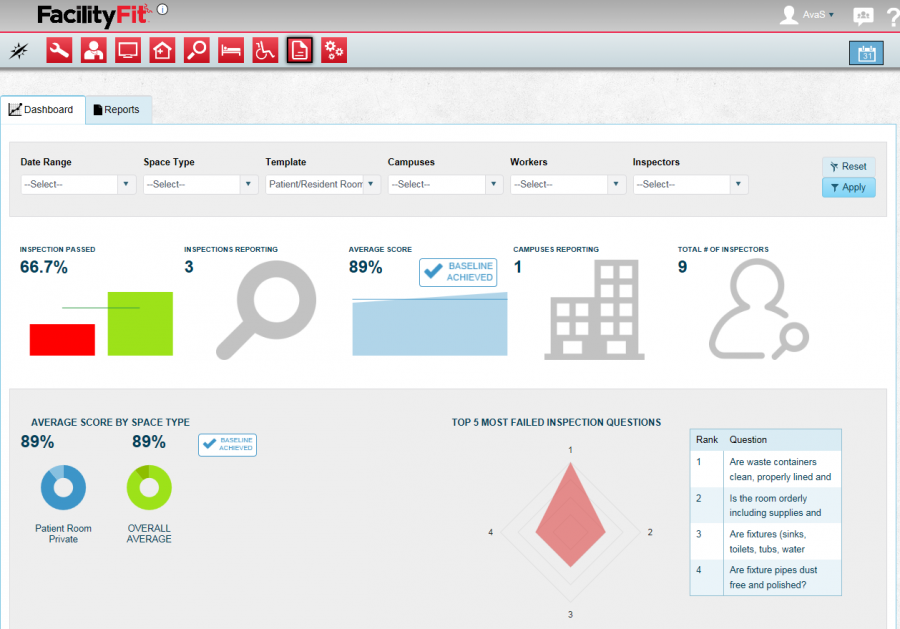
The Dashboard is a visual overview of the fitness of your facilities Functional Areas all in one place. The Dashboard opens in the default view for Patient/Resident room statistics.
Viewing Statistics on the Dashboard
| 1 | Select choices from the drop-down lists. |
| 2 | Click the Apply button to see results. |
| 3 | Click the Reset button to return to the default view. |
Analyzing Dashboard Results
After filtering the dashboard, all of the graphs and charts will be updated to reflect new data. The data is broken down as shown in the following table. If you would like to see more, less, or different data, simply choose an appropriate set of filters as described in Saving, Retrieving and Deleting Custom Filters


